The magazine’s reader survey reveals that average profit per new vehicle retailed still hovers around $800, and that F&I managers are averaging approximately two products per deal.
In an informal study, the magazine sought to benchmark F&I performance last year, and asked readers in October to provide their performance data for the first three quarters of 2011. Results showed that F&I managers performed slightly better than the year-ago period.
The average interest rate during the reporting period stood at 4.84 percent (median was 4.90 percent). Readers also listed Chase, Ally, Wells Fargo, Fifth Third Bank, Capital One, Bank of America, US Bank and TD Auto Finance as their top finance sources.
Ad Loading...
As for F&I tools used, 89.2 percent of respondents said they use a menu, while 48.6 percent said they also used electronic rating capabilities. As for electronic contracting of F&I products, 36.2 percent said they e-contract, while 35.2 percent said they’ve never used electronic contracting and rating tools.
As for acceptance rates, GAP, prepaid maintenance and service contracts made slight gains from the year-ago period, with respondents averaging about 2.09 products per deal (median was 2 products per deal). Theft-deterrent products and tire-and-wheel protection also penetrated well for respondents, with most other products recording acceptance rates below 20 percent.
This snapshot of F&I performance shows that while auto finance continued to loosen up, there were some restrictions. But it appears finance sources are more welcoming of F&I products.
(Click charts for larger image)
1. What Is Your Average Profit Per Retail Unit?
Ad Loading...
The average profit per new vehicle sold was $804.82, compared to $883.05 for used. The median average profit per vehicle retailed for new was $875.50 vs. $1,000 for used.
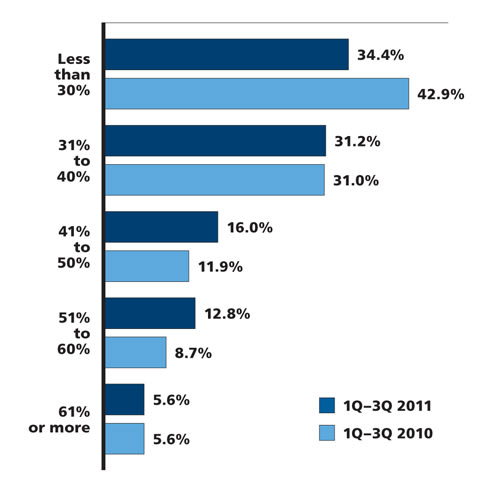
2. What Is Your GAP Penetration Rate?
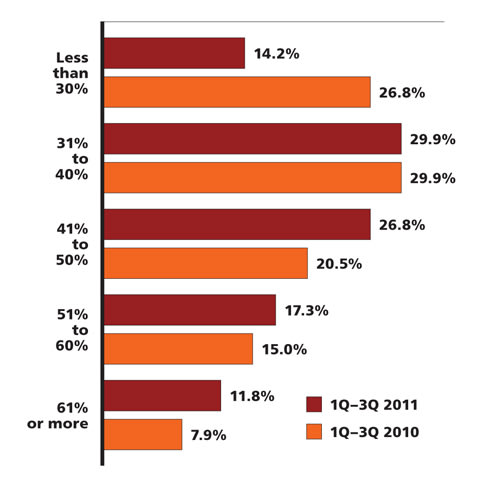
The average acceptance rate for GAP among respondents was 34.9 percent for the first three quarters of last year vs. 32 percent for the first three quarters of 2010.
3. What Is Your Vehicle Service Contract Penetration Rate?
The average acceptance rate for service contracts increased from 35 percent for the first three quarters of 2010 to 46 percent for the first three quarters of last year.
Ad Loading...
[PAGEBREAK]
4. What Is Your Prepaid Maintenance Penetration Rate?
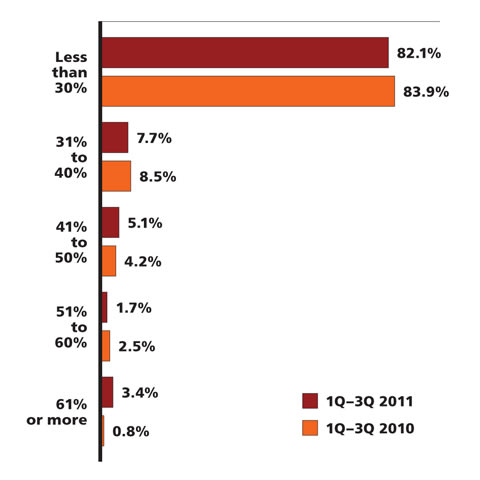
Customers accepted prepaid maintenance plans at a 21 percent clip for the first three quarters of 2011 vs. 19.1 percent for the same period in 2010.
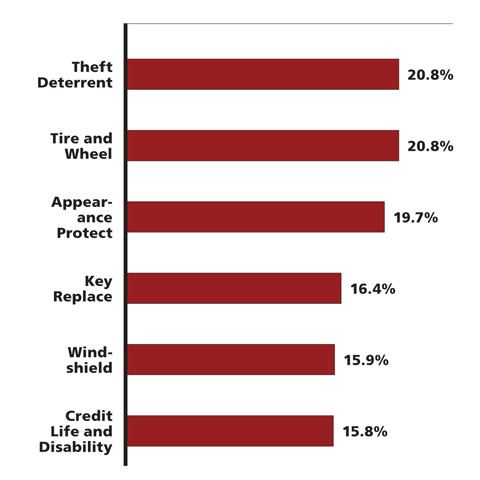
5. What Is Your Penetration Rate for All Other Products?
Theft-deterrent products and tire-and-wheel led the way for F&I managers last year, with appearance protection falling just below the 20 percent penetration mark.
Ad Loading...
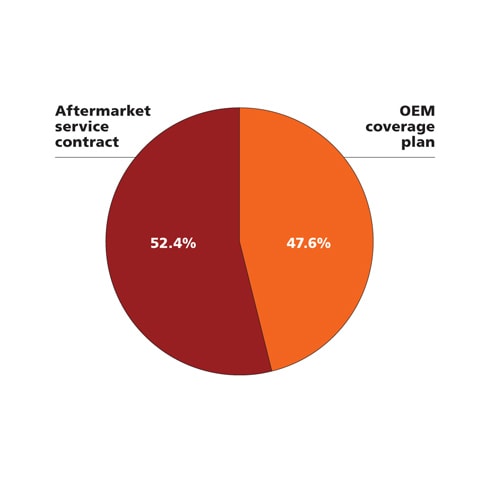
6. Which Sell Better, Aftermarket VSCs or Your OEM’s Coverage Plan?
The disparity between aftermarket VSC plans and OEM plans wasn’t much. In last year’s study, 54 percent of respondents said aftermarket plans sold better vs. 46 percent for captive plans.
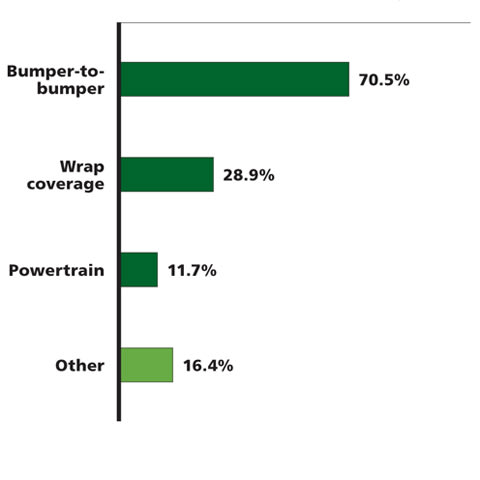
7. What Types of Plans Are You Currently Selling?
The breakdown virtually mirrored what was recorded in last year’s study, which had 91.4 percent of respondents indicating that they offer bumper-to-bumper plans.
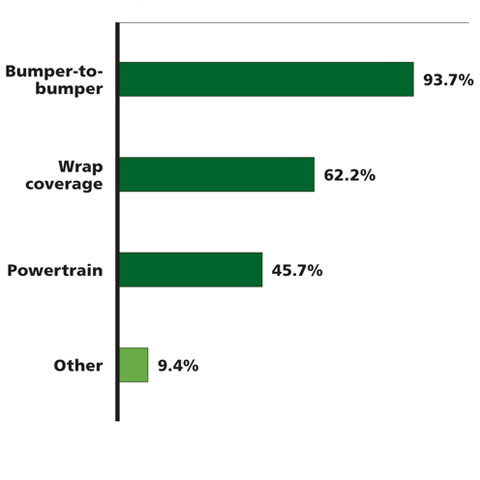
8. What Is Your Penetration Rate for Each Type of Plan?
Ad Loading...
The percentages were virtually identical to what was recorded in last year’s study, although powertrain acceptance rates dropped from 17.1 percent to 11.7 percent this year.
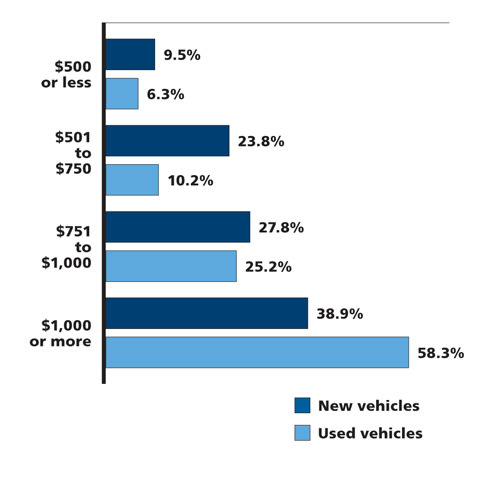
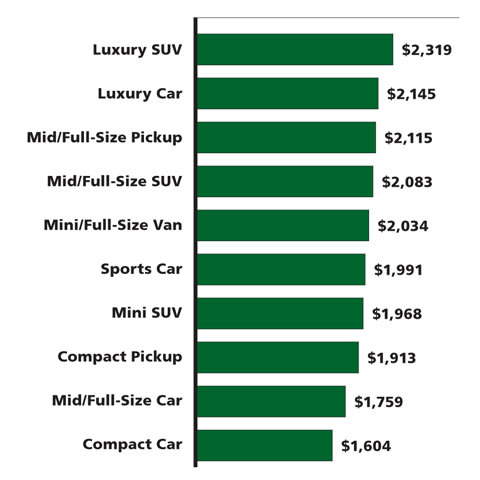
9. What Is the Average VSC Price New-Car Customers are Paying?
The study also asked readers about popular terms. Five-year, 100,000-mile plans led the way for new, followed by six-year, 75,000-mile and seven-year, 100,000-mile plans.
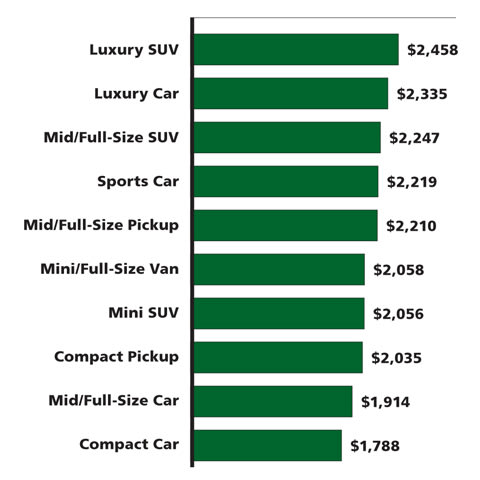
10. What Is the Average VSC Price Used-Car Customers are Paying?
The study also looked at popular terms for used. Three-year, 36,000-mile plans led the way, followed by four-year, 48,000-mile and five-year, 100,000-mile plans.
Auto loan originations rose over 6% year-over-year in the third quarter of 2025, but TransUnion predicts a slight decline in auto loan growth this year, making it an outlier in the company's overall lending forecast.
December brought some of the best borrowing availability for consumers in years, though lenders tightened their reins on riskier segments of the market.