BLACK BOOK – Wholesale Prices, Week Ending July 31st
As manufacturers find creative solutions to deal with the semiconductor chip shortage and dealerships continue to strategically procure inventory, wholesale prices declined for the fifth consecutive week. Although the last few weeks of declines don’t compare much to the prior twenty-two weeks’ average rate of increases, this change of direction may mark the turning point for the automotive market. New vehicles are being produced; however, some are without previously standard equipment like head-up displays, adaptive cruise, and start-stop functions.
This Week Last Week 2017-2019 Average (Same Week)
Car segments -0.68% -0.63% -0.31%
Truck & SUV segments -0.47% -0.49% -0.19%
Market -0.54% -0.54% -0.24%
Car Segments
On a volume-weighted basis, the overall Car segment decreased -0.68%. For reference, the previous week decreased by –0.63%.
Sub-Compact Cars have increased for 25 consecutive weeks, this week at +0.23%.
Full-size Cars had the steepest decline at –1.19%, followed closely by Mid-Size (-1.14%) and Compact (-1.02%) cars.
Seven of the nine segments declined this week.
Truck / SUV Segments
On a volume-weighted basis, the overall Truck segment decreased -0.47% this past week.
For reference, the previous week decreased by -0.49%.
Compact & Full-Size Vans had weekly gains of +0.43%.
Compact Luxury Crossover/SUVs had the steepest decline at -1.01%, followed by Mid-Size Luxury Crossovers/SUVs at –0.81%.
Weekly Wholesale Index
Calendar year 2020 ended with used wholesale prices at elevated levels. With economic patterns (including the automotive market) driven by the pandemic, normal seasonal patterns (e.g., 2019 calendar year) in the wholesale market were not observed for most of the year. We saw a similar picture in 2009, at the end of the Great Recession. Calendar year 2021 has not had typical seasonality patterns as the market had rapid increases in wholesale values for the majority of the year so far. After reaching record heights at the end of June, wholesale prices started to come down for the first time this year in July.
The graph below looks at trends in wholesale prices of 2-6-year-old vehicles, indexed to the first week of the year.
Retail (Used and New) Insights
General Motors and its automated cruise control driving subsidiary have asked a U.S. federal court to stop Ford Motor Co. from using the name “BlueCruise” to market its hands-free driving technology.
Mitsubishi announced that their Outlander Plug-In Hybrid – expected in the second half of 2022 – will have more range than the prior model and three rows of seating.
Automakers continue to adjust production schedules as they cope with reduced deliveries of microchips – General Motors and Volkswagens’ assembly lines recently topped the list of production plan changes issued by AutoForecast Solutions, which is tracking the chip shortage impact. The firm now estimates that the industry has lost a total of 1.8 million cars and trucks in North America because of the chip shortage so far.
Used Retail Prices
With the proliferation of ‘no-haggle pricing’ for used-vehicle retailing, asking prices accurately measure trends in the retail space. Retail demand slowed down at the end of last year, and thus resulted in declining retail asking prices for the last several weeks of 2020. As demand rebounded, retail prices have lagged slightly behind wholesale prices, but March had an accelerated growth in retail prices. In April and May, retail prices picked up speed as demand accelerated, fueled by stimulus payments, tax season, and shortages of new inventory. In June, retail prices continued to rise. After strong Spring and Summer months, retail listing prices have started to fall. Currently, retail prices are more than 24% above where we started the year.
This analysis is based on approximately two million vehicles listed for sale on US dealer lots. The graph below looks at 2-6-year-old vehicles.
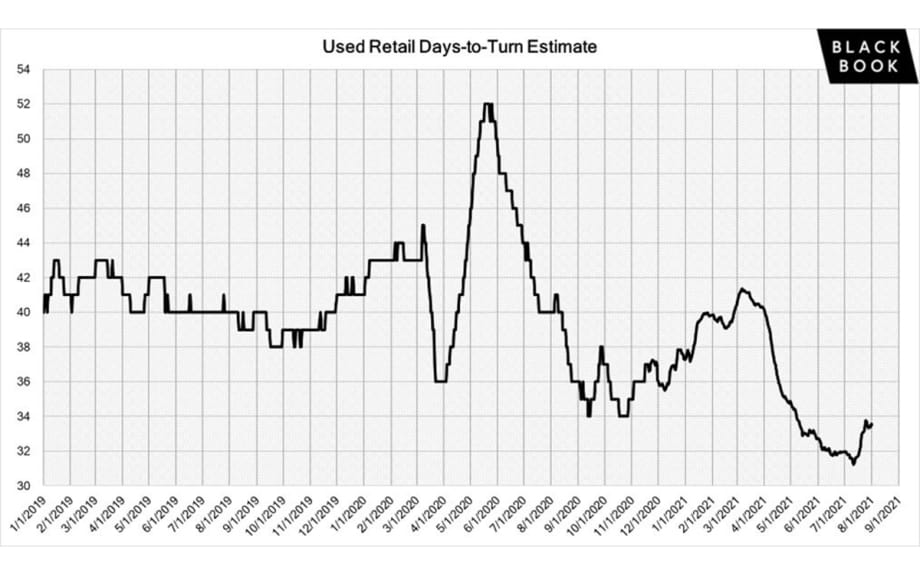
Inventory
Current used retail listing volume is about 11% below the start of the year. As retail demand softened in the last several weeks (both for new and used vehicles), used inventory had remained relatively flat but is now starting to decrease again.
Days-to-turn for used retail listings have been increasing, as retail demand softened over the last few weeks. The days-to-turn now sits just below 34 days, which is still lower than what is typically expected in a normal year.
Wholesale
As floor pricing remains strong and the availability of average and clean vehicles continues to be scarce, conversion rates have been going down over the last several weeks. The average sell rate now sits around 64%, which is the lowest average weekly rate since the end of February. We anticipate sell rates will slowly fall until floor prices come down.
Despite the limited inventory on dealer lots, dealer lanes continue to have higher volume at auction, while manufacturers’ remarketing lanes are offering less and less in open sales channels. Dealers have found creative ways to diversify their source of inventory and their innovation seems to be paying off.
Sellers are becoming more flexible with their floors in the lanes as vehicle values start to decrease. With semiconductor chips still in short supply, the new inventory pipeline continues to be extremely limited. Because of the scarcity in the wholesale market, vehicles with slight damage or open recalls are still selling, if the price is right.